
The S&P 500’s concentration has become one of the market’s favorite warning signs. But are the largest companies really the part of the market investors should be most worried about?
This week, I take a closer look at the numbers behind the concentration debate. The answer is more nuanced than the headlines suggest, and it may change how we think about valuation, diversification, and risk in today’s market.
The Concentration Story Isn’t What You Think
Every few months, a fresh wave of headlines warns that the S&P 500 is dangerously top-heavy, that a handful of mega-cap names have inflated the index to unsustainable levels and investors are one earnings miss away from a painful reset. The data tells a more layered story, and it’s worth unpacking.
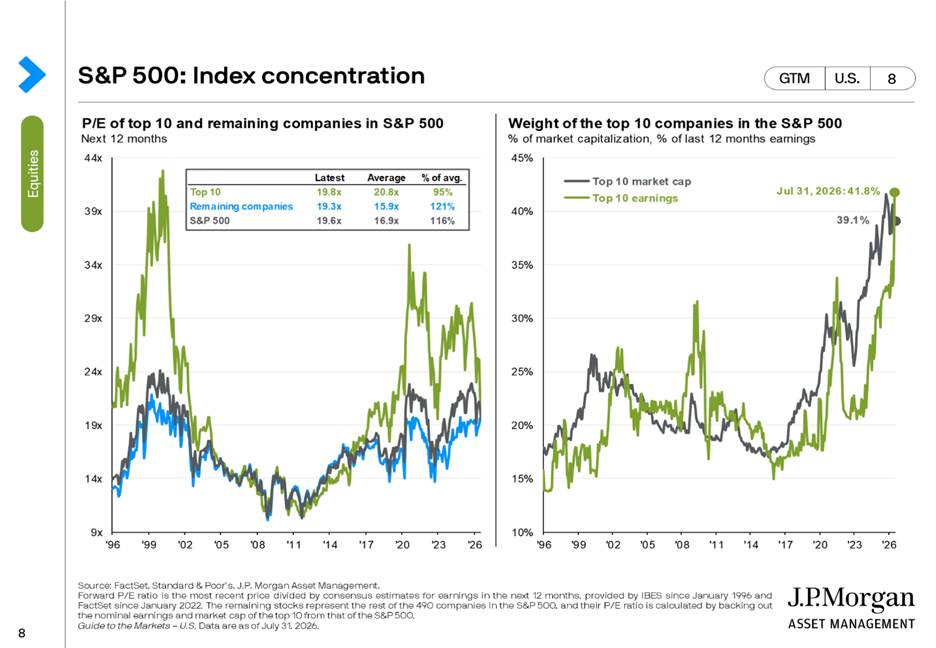
Valuations: the top 10 are actually cheap relative to their own history
Using forward price-to-earnings ratios (price divided by consensus estimates for the next 12 months), here’s where things stood as of July 31, 2026:
Read that table carefully, because it inverts the popular narrative. The top 10 companies, the group most often accused of trading at bubble valuations, are currently priced below their own 30-year average multiple. Meanwhile, the “other 490” stocks, and the index as a whole, are trading well above their historical norms.
In other words: if there’s a pocket of the market that looks historically stretched right now, it isn’t mega-cap tech. It’s the broad market underneath it.
Earnings are outrunning price, not the other way around
The second half of the picture is arguably more important. As of the same date, the top 10 companies represented:
- 39.1% of the S&P 500’s total market capitalization
- 41.8% of the index’s trailing 12-month earnings
The top 10’s share of index profits now exceeds their share of index price. These companies aren’t just large, they’re generating a disproportionately large slice of the earnings pie relative to the market-cap weight they carry. By this measure, the case that concentration reflects fundamentals rather than speculative excess is fairly strong: earnings concentration is leading price concentration, not lagging it.
What this means, and what it doesn’t:
This data supports a more balanced read than either extreme in the current debate:
- It’s not simply “Big Tech is in a bubble.” On a relative-to-history basis, the largest companies in the index are actually trading at a discount to their own long-run multiple, and their earnings power justifies a large share of the index.
- It’s also not “nothing to worry about.” A few caveats are worth keeping in mind:
- “Below average” is not the same as “cheap.” A forward multiple near 20x is still a rich absolute valuation, it only looks modest next to the extremes of the late-1990s and 2020-21 tech run-ups, periods that themselves stretched the historical average higher.
- Forward earnings estimates carry real estimation risk. A meaningful share of expected earnings growth for the largest companies is tied to continued AI infrastructure spending. If that spending or its payoff disappoints, the earnings side of this equation, and the “cheap relative to earnings” conclusion, could shift quickly.
- Concentration itself is a standalone risk, regardless of valuation. With the top 10 names commanding roughly 40% of the index, a single company-specific shock, a regulatory action, a guidance miss, a shift in AI capex plans, has outsized power to move the entire market, independent of whether those stocks are “fairly valued.”
- The more overlooked risk may be sitting in the other 490 stocks. If the broad market is trading at 121% of its historical average multiple, that’s the segment more exposed to multiple compression, even if the mega-caps hold up.
The takeaway
The concentration debate tends to get framed as a binary, either mega-cap tech is a bubble, or concentration doesn’t matter. The current data argues for something more precise: index concentration is currently being backed by disproportionate earnings contribution rather than pure price momentum, and it’s the broader market, not the top 10, that looks stretched relative to history. That doesn’t eliminate concentration risk, a market where 10 stocks are 40% of the index is inherently more fragile to idiosyncratic shocks, but it does mean the risk story is more nuanced than “the biggest stocks are the most overvalued.”
What this means for financial advisors and their clients:
For advisors, this data is a useful antidote to headline anxiety, but not a green light to dismiss concentration risk altogether. Clients who’ve heard “the market is a bubble” in the media may need reassurance that the largest index names are, by this measure, trading in line with or below their own historical norms, and that their earnings growth has largely kept pace with their rising index weight. At the same time, this is a good moment to revisit portfolio-level exposure: many clients holding a plain S&P 500 index fund may not realize that roughly 40% of their “diversified” position sits in ten stocks, and that the other 490 names, often assumed to be the “safer,” more reasonably priced part of the index, are actually trading above their own historical average multiple. That’s worth surfacing in client conversations about true diversification, position sizing relative to concentration risk, and whether complementary allocations (equal-weight strategies, international exposure, or active management with different sector tilts) make sense for clients who are uncomfortable with single-stock-driven index risk. As always, the goal isn’t to time a call on mega-cap tech, but to make sure clients understand what they actually own and why.
Be sure to like and subscribe to the Adjusted for Risk YouTube Channel.
This week on Adjusted for Risk:
Adjusted for Risk: Why Insider “Skin in the Game” May Beat the S&P 500.
I had the pleasure of speaking with Haren Bhakta, founder and CEO of the Inside Ownership Index, who argues high insider ownership aligns management with shareholders, supports long-term innovation, and avoids value-destroying incentives—citing ownership patterns among 100-baggers and major S&P value destroyers.
The Week Ahead
Be on the lookout for our next episode of Adjusted for Risk, where I sat down with Matt Halloran, Chief Evangelist of Zocks, to discuss the risk for advisors who do not accept AI.


Leave a Reply